Comparing the Visual Language of Organic vs. Paid Social Growth Marketing

Website visitors often judge credibility through prominent visual cues before they examine detailed claims. Research summarized by Nielsen Norman Group explains that people notice high-contrast, large, or familiar elements and interpret them through prior experience. This makes visual language especially important on social growth landing pages, where buyers must assess an unfamiliar service quickly.
A useful paid-growth case study is Social Crow. Its landing page combines phone imagery, growth charts, countdown-style urgency, performance figures, and trust-badge iconography. These elements describe speed, visibility, and reassurance without requiring visitors to read every line. The review below considers those design choices as communication devices, not as proof that the service is effective, safe, or legitimate.
Thesis: Two Offers, Two Visual Dialects
Organic coaching brands usually sell a process. Their pages often feature a strategist’s portrait, screenshots of content calendars, educational videos, community images, and long-form testimonials. Softer colors and generous spacing can support a message built around patience, expertise, and sustained improvement. The visitor is invited to imagine learning a repeatable method.
Follower-selling services sell a more immediate outcome. Their visual language therefore tends to emphasize quantities, speed, platform-style notifications, phone mockups, and rising lines. The reviewed page follows this pattern. A phone image makes the promised result feel close to the user’s normal social experience, while charts turn an abstract idea, audience growth, into a visible upward direction.
This distinction matches the offers themselves. Coaching asks a prospect to commit time, attention, and effort. A paid-growth service asks the prospect to select a quantity and complete a transaction. Clear steps and bold numerical cards shorten that mental journey. Findings from the Baymard Institute show that users often rely on a page’s visual feeling of security, especially around payment fields. Badges, reassuring microcopy, and visually robust layouts can increase perceived safety even though appearance alone says nothing about the underlying transaction.
Antithesis: The Categories Often Look Alike
The contrast weakens under closer review. Organic consultants also use upward charts, smartphone frames, client metrics, limited-enrollment banners, and timers for webinars or cohort launches. Paid services may adopt muted palettes, educational sections, case-study layouts, and language about sustainable communities. Once these conventions cross over, a visitor cannot reliably identify the business model from design alone.
Shared imagery works because both categories address the same audience anxiety: slow or uncertain growth. Designers also observe public social media visual trends when selecting familiar layouts, colors, and interface elements. A rising graph supplies a simple before-and-after story, while a phone mockup places the outcome inside a recognizable setting. Testimonials and numerical counters reduce the feeling that the buyer would be acting alone. Yet each cue remains a framing device, not independent verification.
Countdown timers deserve particular care. A genuine deadline can help users understand when an offer ends. A timer that resets or implies scarcity that does not exist can distort choice. The Federal Trade Commission identifies false time limits as a dark-pattern tactic when they lead consumers to believe an offer is temporary when it is not. The presence of a timer does not establish deception, but its accuracy and context matter.
Reading the Case Study More Carefully
On the reviewed landing page, growth-chart graphics present expansion as a measurable trajectory. Countdown-style components introduce urgency, while icon-based assurances about passwords, guarantees, support, and security function like trust badges. The site also displays client, delivery, order, satisfaction, and review figures. Those are claims made by the page itself, and the design gives them prominence. A careful reviewer should distinguish displayed claims from figures verified by an independent auditor.
The same standard should apply to an organic coach. Polished portraits do not prove expertise, and a dashboard screenshot does not reveal attribution, timeframe, or typical results. Testimonials may be sincere while still representing selected outcomes. Useful evaluation moves beyond surface style to named methods, clear pricing, cancellation terms, privacy practices, accessible support, and evidence that can be checked outside the seller’s page.
Synthesis: Design Reveals the Psychology of Tech Marketing
Organic and paid social-growth pages are less like opposites than neighboring dialects. One usually visualizes guidance and gradual progress; the other visualizes speed and numerical momentum. Both translate an uncertain digital service into familiar symbols that make the offer easier to process.
The broader lesson is that tech marketing depends heavily on cognitive shortcuts. People use prominence, familiarity, social proof, and visual reassurance because fully investigating every claim takes time. Responsible design can help visitors understand an offer. Aggressive design can push those same shortcuts beyond clarity and toward pressure.
Consumers therefore benefit from separating three questions: What does the page show, what does the company claim, and what evidence confirms it? Marketers, meanwhile, can build durable trust by making deadlines truthful, labeling illustrative charts, explaining metrics, and placing important terms where people can see them. As growth services evolve, transparent context will matter more than whether a page looks organic or paid.


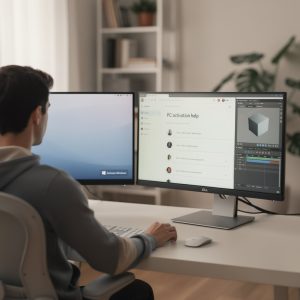
 Scroll through any social media feed, and the pattern becomes clear: bold, well-designed visuals grab attention, whether it’s an Instagram post, a tweet with an image, or a Facebook ad, the quality of the graphics often determines whether users stop to look or keep scrolling. But beyond personal observation, what does the data say? In short,
  Images created by AI can display pixel configurations that are repetitive or strange, which can’t be seen with the human eye.


 Music and visuals are intertwined. This connection is especially visible in the streaming age. Computer graphics play a crucial role in boosting a song’s visibility. Think about album art, animated content, and motion graphics. They all contribute to a song’s success on platforms like Spotify.
 Incorporating computer visuals has greatly improved the appeal of foreign soccer broadcasts. These technologies have increased the worldwide viewership of the sport and raised fan involvement by giving viewers better and more educational experiences.
 A respectable business will do extensive research to find blogs fit for your target market and niche.
 Computer graphics have become a powerful tool in shaping modern branding strategies. Today, every major brand relies on visually captivating graphics to communicate its identity, values, and message. With the rise of digital platforms, the demand for compelling, high-quality graphics has only intensified, making it essential for businesses to stand out in a crowded marketplace.


 A calibration disk or expert TV calibration are one of the options to tune up your TV. Nevertheless, these choices might be pricey and intricate. Here are the configuration options to adjust for TV calibration if you choose to do it manually.


 Raster Graphics is the creation of high resolution images by using rows and columns of square pixels of a 2D Image. Every pixel in place contains information about hue and color that combines to form a coherent image. Computer graphics rendering by adding more pixels per inch creates a high resolution image that appears sharper and more lifelike.
 The usability of 3D maps makes it possible to tailor navigation scripts for tow truck drivers. Instead of prioritizing the shortest distance, the system can calculate the most efficient route based on factors like:
